Secorun Business Intelligence is an elastic tool that allows free extraction, transformation, analysis and visualization of data coming from any source available at the organization (e.g. the systems such as: ERP, TMS, WMS, MES, CRM, technical security systems, automation systems, structurized Excel sheets, ticket systems) in order to help the companies to better understand and optimize their business processes.
We know that having access to only basic information presented in a simple way such as numbers, sums or average values is too little to get a full understanding of the business situation and make a good decision. Nowadays, there are more advanced analytical tools required that allow processing, analysis and presentation of the data in a dynamic and interactive way. Tools that would make it possible to explore the data, generate hypotheses, identify the data (what is it, what values and contents does it carry, in what processes is it possible to use it, how to interpret it), define the KPI, answer business questions and also visualize the data in a way that is clear and easy to understand.
Tools and services that make up Secorun Business Intelligence include a variety of methods – such as data analysis and understanding, data warehousing, reporting, dashboarding – that help with getting a better knowledge about the data and business processes.
The technological stack used in the solutions allows an easy integration with data from other informatic systems aggregating data related to the organization management. As a result of this, cross-sectional analyses from the Secorun products and all the other systems used at the company can be visualized using Secorun Business Intelligence or other BI tools used in the organization.
“Not using the dormant power of collected data may nowadays be considered as giving up that could hurt the business over time. The competition doesn’t sleep. Using Secorun Business Intelligence and the support of our analysts and data engineers you can maximize taking your chances and minimize materialization of the risks.“
Marcin Cylkowski
Department Director
Design&Implementation Office
Business benefits of the Business Intelligence
Precise prognoses – a friendly and easy to understand form of data presentation and the precise prognosis based on it allow better reaction time and better strategic planning. A possibility of getting values out of the data and transforming them into useful information and knowledge.
Improving the decision processes by automating the processes of reporting and data analysis. A possibility of getting full current knowledge about the data and the business situation resulting from it.
Saving time and resources – the effects of introducing Secorun BI are identification and elimination of ineffective activities, optimization of the business processes and allocation or reduction of the resources.
Better collaboration and flow of information – improving responsible business decision making with accessible and transparent presentations of aggregated data or analysis results for wide groups of stakeholders.
Improvement of the profitability – the access to the current and adequate data allows better understanding of the outside and inside business situation. That results in more accurate decisions and better results as well as the company profitability.
Increasing the competitive advantage – thanks to introducing the Secorun BI organizations are able to react quicker to the market changes. It’s a better personalization resulting in increasing the clients’ loyalty.
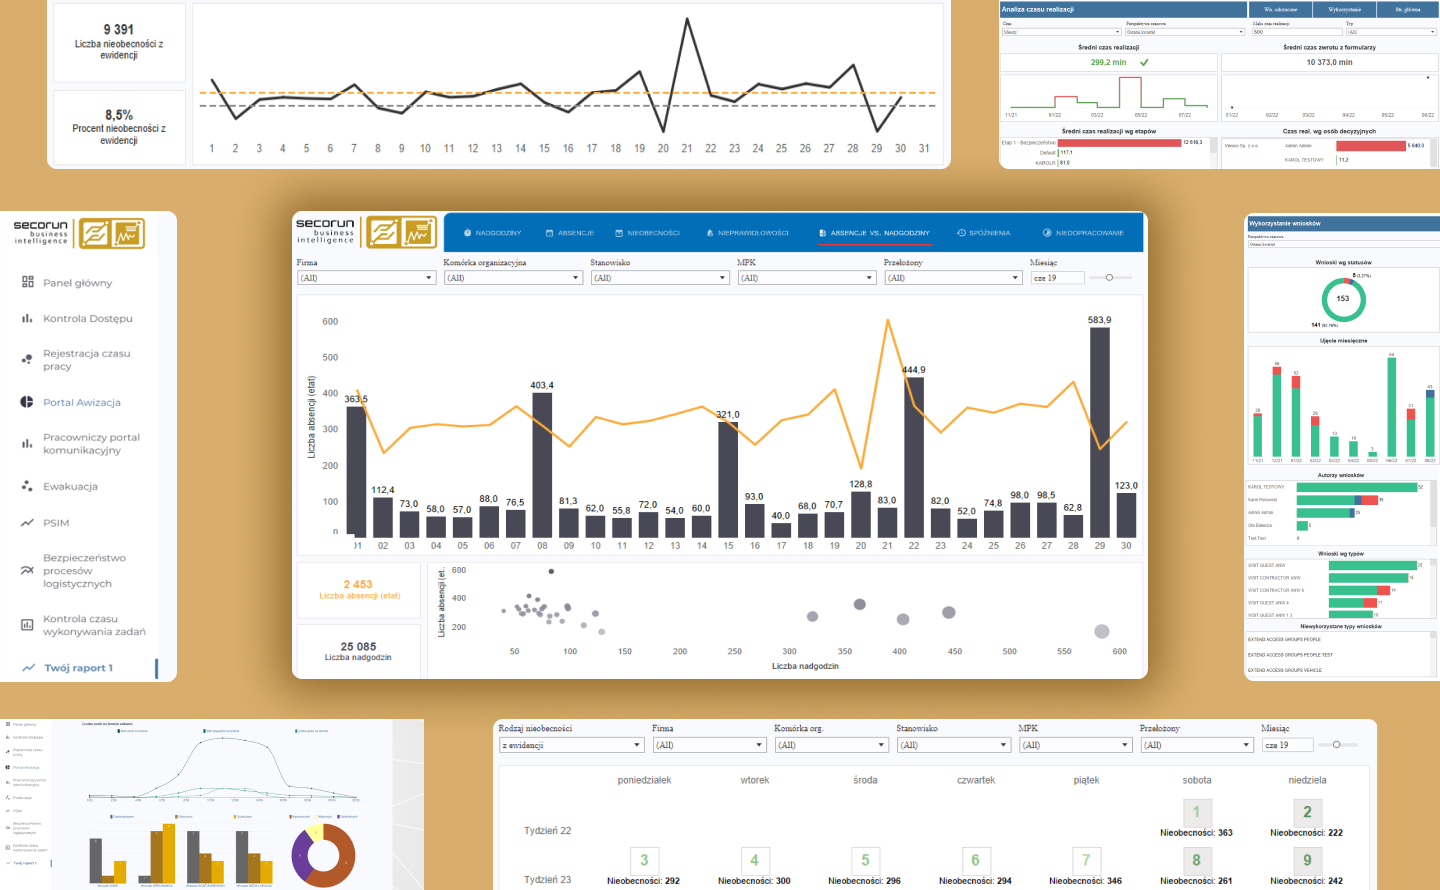
Alina is a production manager at a facility where there is a constant need of supervision over machines and production processes. Because of that, a three-shift work system was introduced.
A few times a year, the employees’ absence significantly increases and causes interruptions in the three-shift system functioning. In that situation the continuity of the production process is endangered and there might be problems with realizing the commissions.
What is the absence percentage per one individual brigade? What is the relation between absences and overtime? Is it possible to find a trend in the employees’ absences? Can we plan and secure the production?
In a large company the Secorun Requests Portal was recently implemented. Thanks to that, outside parties have a well regulated access to the organization.
Especially during the stage of the product implementation it is very important to monitor the readiness and efficiency of the organization in using the product. It is required to define which and what kind of subcontractors have problems with adjusting to the new requirements of the company.
How to localize all the weak spots of the process and find the people who are responsible for slowing down the system or have the biggest ratio of rejected requests?
Do we have a tool to monitor the time of the requests realization and all the related parameters such as the number of rejected, unfilled or wrongly filled requests?
Key functionalities of the Business Intelligence
Extraction, transformation and building an uniform data repository (ETL) – connecting data coming from various sources in order to get one uniform integrated and understandable model of the data occurring in the organization.
Definition and control of the KPI – a process of setting and monitoring indicators important for a company that are used to evaluate the effectiveness of the realized business processes, to identify the problems and to measure the progress and the effectiveness of the activities.
An interactive presentation of data – the user can interact with the data visualizations to understand them better. It can include functions such as filtering, sorting and exploring the data in different views.
Comparing many parameters in a graphic presentation – it can be done using different types of visualization such as bar graphs, linear graphs, pie charts and a lot more.
Nested reports – tools that allow creating complicated reports with many data nesting levels and various levels of information such as summaries, details, charts and tables.
Access to cross-sectional analytic reports from the level of Secorun Business Intelligence for several products and systems allows getting an insight into data from many sources making the data comparison and getting a complete picture of the situation quick and easy.
Dashboards customization – the users have access to a tool that allows them to easily create analytic views adjusted to their needs, including various charts, tables, indicators, alerts, etc.
Rich library of charts, graphs, graphic templates allows presenting the data in many different ways and adjusting suitable chart types to the presented information.
Mobile access to the data, reports and analyses allows the employees being away from the office to have real-time access to current business information, making the management more effective.
Full gradation of the permissions and an adjustable insight into the data – the system allows setting different levels of access to the data that are adjusted to the user’s needs.
“Statements. Csv, xls, txt files. Data scattered in suppliers databases. Manual data cleaning. Pivot tables. It’s all been there. That homework is already done. It’s time to take data exploration to the next level.”
Marcin Cylkowski
Department Director
Design&Implementation Office

Integration with third-party systems
The Business Intelligence has all the tools needed to integrate with any source of data, such as CRM, ERP, TMS, WMS, CCTV, Access Control, Time & Attendance, automation, operating systems or data warehouses already existing at the company.
Currently, Business Intelligence is fully integrated with other Secorun package products::